
Disk geometry & the I/O stack — why spinning disks changed software architecture, and what SSDs didn't fix as much as you'd think
The 5 to 20 milliseconds it takes a hard disk head to move to the right track shaped the entire database industry. SSDs removed the moving parts — but the asymmetry between random and sequential acces

Last week we talked about the memory hierarchy — the stack from CPU registers down to spinning metal, and the enormous latency gaps between each layer. This week we go one level deeper into the bottom two layers of that stack: hard disk drives and solid-state drives. Not because database engineers need to know how to manufacture storage hardware, but because the physical geometry of these devices creates constraints that travel all the way up through the OS, through the database engine, and into every schema and index design decision you’ll ever make.
There’s a number that shapes nearly every database storage decision ever made: 7 to 23 milliseconds. That’s the time it takes a hard disk drive to perform a random read — the combined cost of moving a mechanical arm to the right track and waiting for the platter to rotate the right sector underneath it. During those 20 milliseconds, a 3GHz CPU executes roughly 60 million instructions. An entire sorting algorithm can run to completion. A round-trip TCP packet can cross a continent and come back. And yet, for decades, every database application had to wait this long to fetch a single row that wasn’t cached in memory.
That constraint — mechanical movement as the bottleneck for data access — is the origin story of almost every database structure you’ll encounter in this newsletter.
Inside a hard disk drive
A hard disk drive is, at its core, a precision optical instrument wearing the clothes of a storage device.
The data is stored on one or more platters — circular discs coated in magnetic material, stacked on a central spindle, spinning at 5,400 to 15,000 rotations per minute. Each platter has two surfaces, and each surface has a dedicated read/write head that floats on a cushion of air just a few nanometers above the surface. The head never touches the platter — if it does, that’s a head crash, and it destroys the data beneath it permanently.
The magnetic coating is divided into concentric circles called tracks. Each track is further divided into sectors — arc-shaped segments that are the smallest unit the drive can independently read or write. On modern drives, a sector is 4KB.
The heads are mounted on an actuator arm that pivots on a fixed point at the edge of the platters. To read a specific sector, the arm swings the head to the right track (seek), then waits for the platter’s rotation to bring the right sector under the head (rotational latency), and then reads continuously as the sector passes.
This is the physical geometry that every database storage decision must work around.
Seek time: the most expensive thing a database can do
Seek time is the time it takes for the actuator arm to swing to the correct track. This depends entirely on how far the head has to travel — from its current position to the target track. The average seek time on a modern HDD is 5 to 15 milliseconds for a random access. The minimum (adjacent tracks) is around 1ms. The maximum (full platter sweep) is around 20ms.
Rotational latency: waiting for the platter
Once the head is over the correct track, the platter still has to rotate until the right sector is underneath. This is rotational latency. At 7,200 RPM — a common server disk speed — the platter completes one full revolution in 8.3 milliseconds. Average rotational latency is half that: about 4ms. In the worst case (the sector just passed the head as it arrived), you wait almost a full revolution.
Transfer time: the fast part
Once the head is positioned correctly, data flows continuously at the drive’s full throughput — typically 100 to 200 MB/s for a modern HDD. Reading a single 8KB database page takes well under 0.1ms once the head is there. The data transfer is not the problem. The positioning is the problem.
What this means for software
The total random read cost — seek + rotational latency + transfer — is 7 to 23ms. But sequential reads pay the positioning cost only once, at the start. After that, data flows continuously. If you read 1,000 sequential 8KB pages, you pay one seek and then read at full throughput. If you read 1,000 random 8KB pages scattered across the disk, you pay the full 7–23ms positioning cost 1,000 times.
That’s the inequality every database storage engine is designed around:
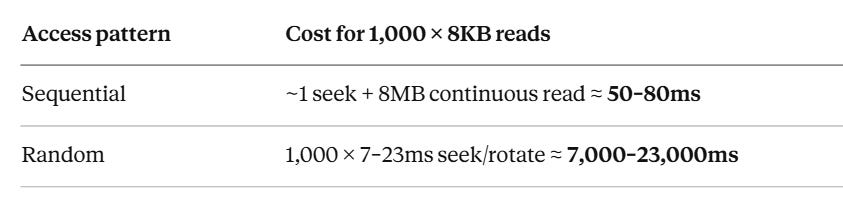
A factor of 100–300x difference. Not for a different workload. For the exact same 8MB of data, in different access patterns.
This is why database engineers obsess over access patterns. This is why B-trees cluster related keys on adjacent pages. This is why write-ahead logs append sequentially before touching scattered data pages. The entire structure of every storage engine you’ll study is a response to this single inequality.
Solid-state drives — what changed, what didn’t
SSDs replaced mechanical components with NAND flash memory. No platters. No spindle. No actuator arm. No seek time. No rotational latency. The time to initiate a random read dropped from 7–23ms to 50–150 microseconds — a 100x improvement. Every database got meaningfully faster without any code changes just by replacing spinning disks with SSDs.
But “no moving parts” doesn’t mean “no constraints.” SSDs have their own geometry — different from HDDs, but equally consequential.
NAND flash structure: pages and blocks
NAND flash is organised in a hierarchy. At the bottom: individual cells, each storing 1 to 4 bits depending on the type of flash (SLC, MLC, TLC, QLC). Cells are grouped into pages, typically 4KB to 16KB — the smallest unit that can be read or written. Pages are grouped into blocks, typically 128 to 512 pages — typically 256KB to 4MB of storage per block.
Here is the constraint that matters: you can only write to a page that has been erased. And you can only erase at the block level, not the page level.
This means you cannot update a single page in place. To overwrite a 4KB page, the SSD must:
Read the entire block containing that page into a buffer (~256KB)
Erase the entire block (a relatively slow operation, 1–5ms)
Modify the target page in the buffer
Write the entire block back to flash
The SSD firmware handles this transparently — to your operating system, it looks like any other random write. But under the hood, updating 4KB of data causes the SSD to write 256KB to 512KB of data. This ratio — bytes actually written to flash divided by bytes the application intended to write — is called write amplification. On a busy database with many small random writes, write amplification factors of 10x to 30x are common.
Wear levelling: why SSDs have a write budget
Every erase cycle degrades the oxide layer in each flash cell. Consumer NAND flash cells are rated for roughly 3,000 erase cycles; enterprise multi-level cell (MLC) flash for around 100,000. Once a cell exceeds its cycle limit, it can no longer reliably hold charge — it starts flipping bits silently.
SSD firmware addresses this with wear levelling: it tracks the erase cycle count of every block and deliberately spreads writes across all blocks rather than hammering the same ones repeatedly. This is why an SSD that receives concentrated sequential writes in one region doesn’t wear out that region faster than the rest — the firmware is constantly moving data around in the background.
This background management means SSD write performance isn’t constant. Under heavy sustained write load, the firmware is simultaneously handling new writes, garbage-collecting blocks that are partially valid, and doing wear levelling relocations. This is what causes SSD write performance to degrade under sustained pressure — write cliff — a phenomenon that matters a lot for database write workloads.
NVMe vs SATA: the interface matters too
Early SSDs plugged into the SATA interface — the same connector used for spinning disks. SATA’s maximum throughput is ~550MB/s sequential, and its command queue depth is limited to 32 commands. An NVMe SSD connected directly to the PCIe bus has no such limitations: current NVMe drives deliver 3–7GB/s sequential and support command queue depths of 65,535. For a database receiving thousands of concurrent I/O requests, that queue depth difference matters enormously.
The practical takeaway: “SSD” is not one thing. A SATA SSD in a database server is meaningfully different from an NVMe SSD, which is meaningfully different from enterprise-grade NVMe with power-loss protection capacitors. The device class determines the performance envelope your database operates within.
The OS I/O stack — what happens between your code and the hardware
When your database calls write() to save a WAL record, that data does not immediately go to the SSD or HDD. It goes through a stack of OS layers, each adding behaviour and each potentially delaying or buffering the actual hardware write.
Layer 1: Virtual File System (VFS)
The VFS is a kernel abstraction that presents a unified file system interface regardless of the underlying file system type. Whether Postgres is storing files on ext4, XFS, or a network file system, the database makes the same read(), write(), and fsync() calls. The VFS routes them to the appropriate file system driver.
Layer 2: OS Page Cache — the silent middleman
This is the most important layer for database engineers to understand. The OS page cache is a region of kernel-managed RAM that transparently caches file data. When your application calls
write(), the data lands in the page cache first. The kernel acknowledges the write as complete immediately, then schedules the actual disk write for later — in batches, at its own convenience, optimised for throughput.
From your application’s perspective: the write succeeded. From the hardware’s perspective: nothing has happened yet.
This is not a bug. For most applications, this behaviour is desirable — it makes writes fast and amortises disk I/O. But for a database that has promised durability, it is a serious problem. If the machine loses power after a write() but before the kernel flushes the page cache to disk, the data is gone. The write returned success. The OS confirmed it. And the data still doesn’t exist on any non-volatile medium.
Layer 3: fsync() — the bypass
fsync() is the system call that forces the OS to flush all buffered writes for a file descriptor to the storage device and wait until the device confirms. It bypasses the “defer to later” behaviour of the page cache. When Postgres calls fsync() after writing a WAL record, it blocks until that record is confirmed on physical storage — not just in the OS page cache.
This is expensive. On an HDD: 10–30ms. On an SSD: 500µs to 5ms. On a busy system processing many commits per second, fsync() cost is often the single largest contributor to write latency.
This is why the WAL exists. Instead of fsyncing every modified table page on every commit — which could be gigabytes of data — Postgres writes a compact log record (typically a few hundred bytes), fsyncs that, and returns the commit. The actual table pages are written to disk asynchronously later. The WAL is the minimum durable record needed to reconstruct whatever the async write hasn’t done yet.
Layer 4: O_DIRECT — going around the page cache entirely
Some databases bypass the OS page cache entirely using the O_DIRECT flag when opening files. With O_DIRECT, all reads and writes go directly to the storage hardware, bypassing the kernel’s caching. The database manages its own in-memory page cache (Postgres’s shared_buffers), which it can tune precisely.
O_DIRECT avoids double-buffering (the same data being cached both in the database’s buffer pool and the OS page cache), and it gives the database full control over what’s in memory. MySQL’s InnoDB uses O_DIRECT by default. Postgres does not by default, though it has an option for it.
The trade-off: with O_DIRECT, if the database crashes between a write() and an fsync(), the data is gone — there’s no OS page cache copy to fall back on. The database must handle this entirely with its own WAL and recovery mechanisms. This is fine for a well-designed database engine, but it means the durability guarantees live entirely in database code, not partially in the OS.
Layer 5: I/O scheduler
The block layer sits between the file system and the device driver. It maintains a queue of pending I/O requests and reorders them for throughput — for example, merging adjacent reads into a single larger request, or reordering requests to minimise seek distance on an HDD.
For SSDs, aggressive scheduling is counterproductive — there’s no seek cost to optimise for, and the reordering just adds latency. Modern Linux kernels use mq-deadline or none for NVMe devices, and configure the scheduler accordingly.
For HDDs on database workloads, the scheduler can meaningfully improve throughput by converting random access patterns into more sequential ones. But this is increasingly irrelevant as HDDs disappear from primary storage use cases.
What this means for database configuration
Understanding the I/O stack makes several Postgres configuration knobs make sense immediately:
shared_buffers — Postgres’s in-memory page cache. The larger this is, the more frequently reads are served from RAM rather than triggering OS page cache or disk reads. The general recommendation is 25% of total RAM, but the right value is “as much as you can give it while leaving room for OS and other processes.”
wal_sync_method — controls how Postgres calls fsync. Options include fsync (the default, uses fsync()), fdatasync (slightly more efficient, skips fsyncing file metadata), open_sync, and open_datasync (use O_SYNC/O_DSYNC flags). The right choice depends on your OS and storage hardware.
synchronous_commit — when set to off, Postgres returns commit confirmation to the application before fsyncing the WAL. This dramatically increases write throughput at the cost of potentially losing the last few transactions in a crash. Acceptable for some workloads (logging, analytics). Never acceptable for financial transactions.
checkpoint_completion_target — controls how aggressively Postgres writes dirty (modified) pages from shared_buffers to disk between checkpoints. A lower value means more I/O concentrated at checkpoint time; a higher value spreads it out. The goal is keeping I/O smooth so the storage device doesn’t get hammered with write bursts.
The practical mental model
Two facts to carry forward from this issue into every future discussion of database storage:
1. Random I/O is fundamentally different from sequential I/O. On HDDs, random reads cost 100–300x more than sequential reads for the same data volume. On SSDs, the gap is ~10x. This inequality never goes away — it just gets smaller. Every database storage structure is an attempt to turn random access patterns into sequential ones.
2. The OS page cache lies. A successful write() does not mean data is on disk. A successful fsync() does. The distinction is the foundation of database durability. When your database guarantees that a committed transaction will survive a power failure, it means there was a successful fsync() somewhere in the commit path.
When you see a WAL, a write-ahead log, a redo log, or a journal in any storage system, you are looking at the same idea: a compact sequential append that gets fsynced before the commit is acknowledged, so that the database can recover the full state from just the log if everything else is lost.